Logistic Regression

Classification

October 30, 2024

Binary Outcomes

Binary Outcomes


  • So far we have looked at continuous or numerical outcomes (response variables)
  • We are often also interested in outcome variables that are binary (Yes/No, or 1/0)
    • Did violence happen, or not?
    • Classification: is this email spam?

Example: Conflict Onset


  • Did a civil war begin in a given country in a given year? (yes/no)
  • Predictors: wealth, democracy, terrain, ethnic diversity, etc.
  • Seminal work by Fearon and Laitin (2003)
  • We can use logistic regression to model this binary outcome

Modeling


  • We can treat each outcome (conflict onset) as successes and failures arising from separate Bernoulli trials
  • Bernoulli trial: a random experiment with exactly two possible outcomes, “success” and “failure”, in which the probability of success is the same every time the experiment is conducted
  • Success is usually coded as 1, failure as 0
  • So ironically, conflict onset is a “success” in this context

Modeling


Each Bernoulli trial can have a separate probability of success


\[ y_i ∼ Bern(p) \]

Modeling


  • We can then use the predictor variables to model that probability of success, \(p_i\)
  • We can’t really use a linear model for \(p_i\) (since \(p_i\) must be between 0 and 1) but we can transform the linear model to have the appropriate range

Generalized Linear Models


  • This is a very general way of addressing many problems in regression and the resulting models are called generalized linear models (GLMs)
  • Logistic regression is a very common example

GLMs


All GLMs have the following three characteristics:

  • A probability distribution describing a generative model for the outcome variable
  • A linear model: \[\eta = \beta_0 + \beta_1 X_1 + \cdots + \beta_k X_k\]
  • A link function that relates the linear model to the parameter of the outcome distribution

Logistic Regression


  • Logistic regression is a GLM used to model a binary categorical outcome (0 or 1)
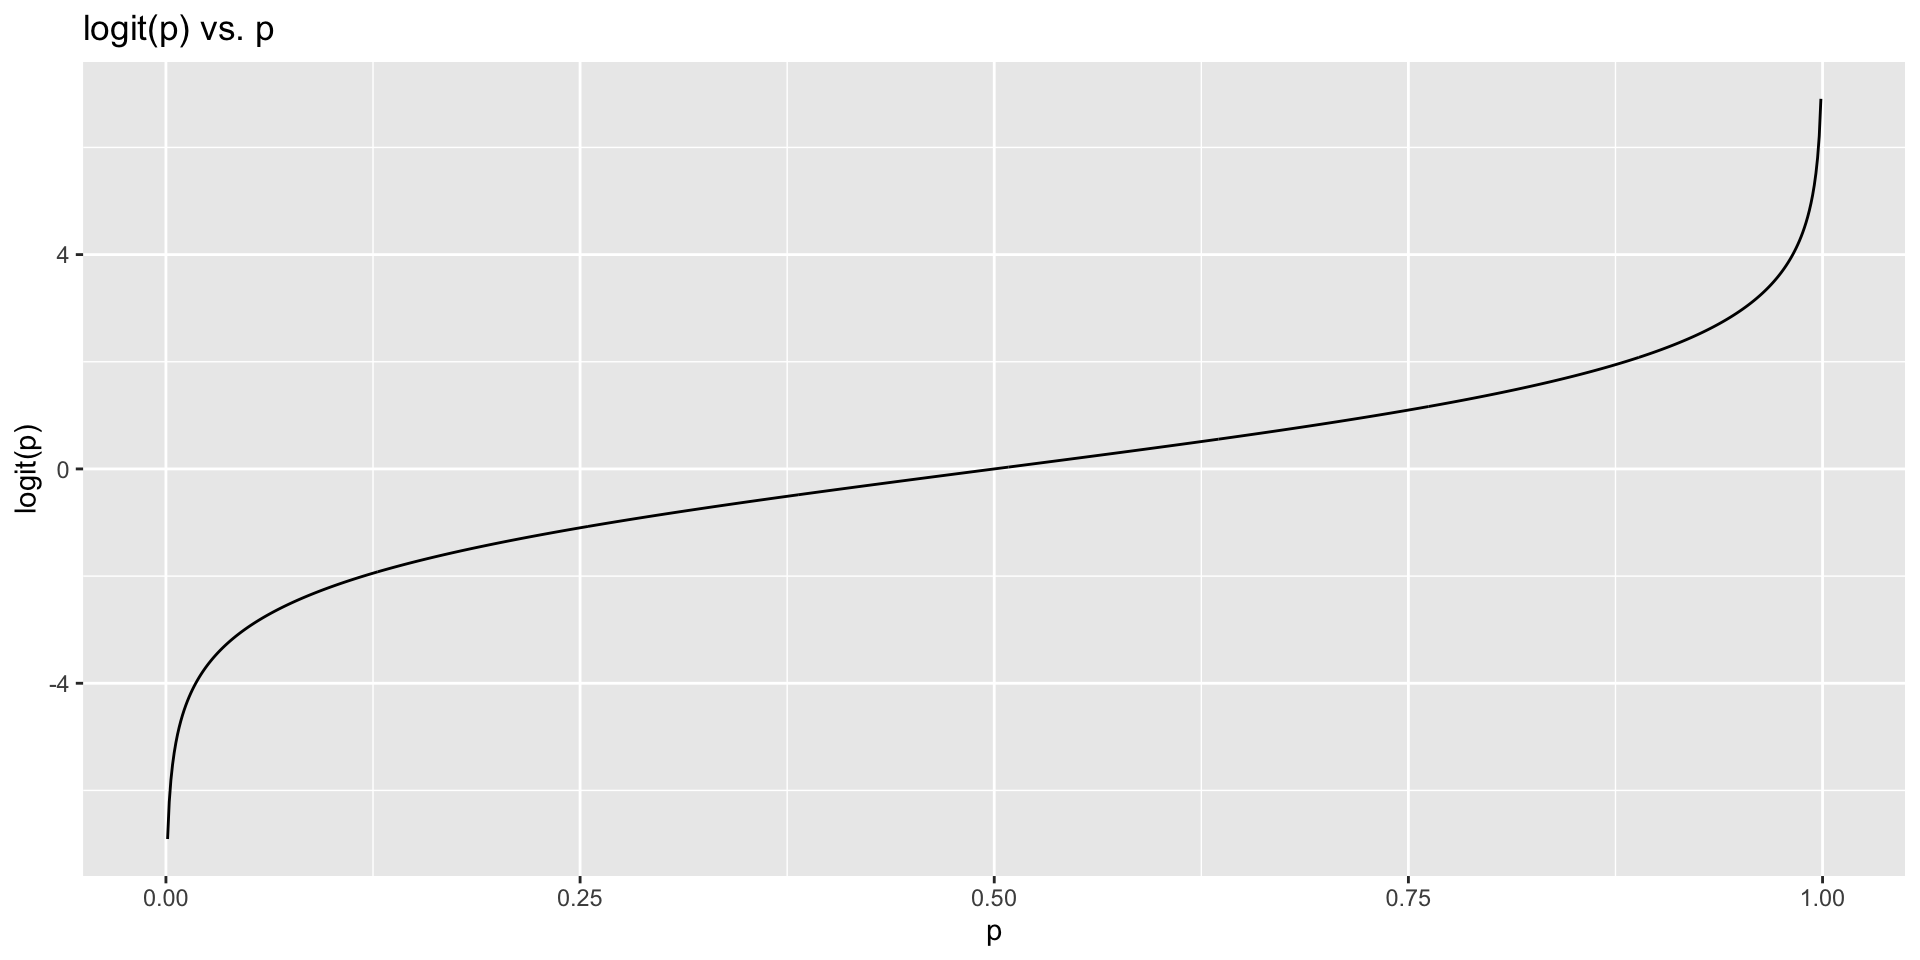
  • In logistic regression, the link function that connects \(\eta_i\) to \(p_i\) is the logit function
  • Logit function: For \(0\le p \le 1\)

\[logit(p) = \log\left(\frac{p}{1-p}\right)\]

Logit Function

Logistic Regression Model


  • \(y_i \sim \text{Bern}(p_i)\)
  • \(\eta_i = \beta_0+ \beta_1 x_{1,i} + \cdots + \beta_n x_{n,i}\)
  • \(\text{logit}(p_i) = \eta_i\)

Logistic Regression Model


  • \(\text{logit}(p_i) = \eta_i = \beta_0+ \beta_1 x_{1,i} + \cdots + \beta_n x_{n,i}\)
  • Now take inverse logit to get \(p\)

\[p_i = \frac{\exp(\beta_0+\beta_1 x_{1,i} + \cdots + \beta_k x_{k,i})}{1+\exp(\beta_0+\beta_1 x_{1,i} + \cdots + \beta_k x_{k,i})}\]

Analyzing Conflict Onset

The peacesciencer Package

  • The peacesciencer package provides a number of datasets and functions for analyzing conflict and peace
  • Provides data from a number of important datasets in the field of conflict studies, e.g.
    • Correlates of War (CoW) project
    • Uppsala Conflict Data Program (UCDP)
    • Militarized Interstate Dispute (MID) dataset
  • Provides functions for analyzing conflict and adding control variables to the dataset

Using the peacesciencer Package


library(peacesciencer)
library(tidymodels)

conflict_df <- create_stateyears(system = 'gw') |>
  filter(year %in% c(1946:1999)) |>
  add_ucdp_acd(type=c("intrastate"), only_wars = FALSE) |>
  add_democracy() |>
  add_creg_fractionalization() |>
  add_sdp_gdp() |>
  add_rugged_terrain()

glimpse(conflict_df)
Rows: 7,036
Columns: 20
$ gwcode         <dbl> 2, 2, 2, 2, 2, 2, 2, 2, 2, 2, 2, 2, 2, 2, 2, 2, 2, 2, 2…
$ statename      <chr> "United States of America", "United States of America",…
$ year           <dbl> 1946, 1947, 1948, 1949, 1950, 1951, 1952, 1953, 1954, 1…
$ ucdpongoing    <dbl> 0, 0, 0, 0, 0, 0, 0, 0, 0, 0, 0, 0, 0, 0, 0, 0, 0, 0, 0…
$ ucdponset      <dbl> 0, 0, 0, 0, 0, 0, 0, 0, 0, 0, 0, 0, 0, 0, 0, 0, 0, 0, 0…
$ maxintensity   <dbl> NA, NA, NA, NA, NA, NA, NA, NA, NA, NA, NA, NA, NA, NA,…
$ conflict_ids   <chr> NA, NA, NA, NA, NA, NA, NA, NA, NA, NA, NA, NA, NA, NA,…
$ v2x_polyarchy  <dbl> 0.605, 0.587, 0.599, 0.599, 0.587, 0.602, 0.601, 0.594,…
$ polity2        <dbl> 10, 10, 10, 10, 10, 10, 10, 10, 10, 10, 10, 10, 10, 10,…
$ xm_qudsest     <dbl> 1.259180, 1.259180, 1.252190, 1.252190, 1.270106, 1.259…
$ ethfrac        <dbl> 0.2226323, 0.2248701, 0.2271561, 0.2294918, 0.2318781, …
$ ethpol         <dbl> 0.4152487, 0.4186156, 0.4220368, 0.4255134, 0.4290458, …
$ relfrac        <dbl> 0.4980802, 0.5009111, 0.5037278, 0.5065309, 0.5093204, …
$ relpol         <dbl> 0.7769888, 0.7770017, 0.7770303, 0.7770729, 0.7771274, …
$ wbgdp2011est   <dbl> 28.539, 28.519, 28.545, 28.534, 28.572, 28.635, 28.669,…
$ wbpopest       <dbl> 18.744, 18.756, 18.781, 18.804, 18.821, 18.832, 18.848,…
$ sdpest         <dbl> 28.478, 28.456, 28.483, 28.469, 28.510, 28.576, 28.611,…
$ wbgdppc2011est <dbl> 9.794, 9.762, 9.764, 9.730, 9.752, 9.803, 9.821, 9.857,…
$ rugged         <dbl> 1.073, 1.073, 1.073, 1.073, 1.073, 1.073, 1.073, 1.073,…
$ newlmtnest     <dbl> 3.214868, 3.214868, 3.214868, 3.214868, 3.214868, 3.214…
Running a Logistic Regression


  • Implementation is not very different from a linear model
  • We just need to update our code to run a GLM
    • specify the model with logistic_reg()
    • use "glm" instead of "lm" as the engine
    • define family = "binomial" for the link function to be used in the model

Bivariate Logistic Regression


conflict_model <- glm(ucdponset ~ wbgdppc2011est,
                  data= conflict_df,
                  family = "binomial")

summary(conflict_model)

Call:
glm(formula = ucdponset ~ wbgdppc2011est, family = "binomial", 
    data = conflict_df)

Coefficients:
               Estimate Std. Error z value Pr(>|z|)    
(Intercept)    -1.16241    0.42606  -2.728  0.00637 ** 
wbgdppc2011est -0.33082    0.05261  -6.289  3.2e-10 ***
---
Signif. codes:  0 '***' 0.001 '**' 0.01 '*' 0.05 '.' 0.1 ' ' 1

(Dispersion parameter for binomial family taken to be 1)

    Null deviance: 1389.6  on 7035  degrees of freedom
Residual deviance: 1358.4  on 7034  degrees of freedom
AIC: 1362.4

Number of Fisher Scoring iterations: 7

Interpreting the Results


\[\log\left(\frac{p}{1-p}\right) = -1.16-0.33\times \text{logGDPpc}\]

Interpreting the Results


  • For a quick interpretation of the coefficients, we can exponentiate them
  • The exponentiated coefficient is the odds ratio
  • For each one-unit increase in the independent variable, the odds of the outcome occurring increase (or decrease) by a factor of the exponentiated coefficient

Interpreting the Results


\[\log\left(\frac{p}{1-p}\right) = -1.16-0.33\times \text{logGDPpc}\]


For each one unit increase in log GDP per capita, the odds of the outcome occurring are multiplied by approximately 0.718, assuming other variables in the model are held constant.


This means that an increase in GDP per capita is associated with a decrease in the odds of the outcome occurring. The odds of the outcome decrease by about 28.2% for each unit increase in GDP per capita (on average).

Your Turn!


  • Run a bivariate logistic regression using ucdp onset as the outcome variable
  • First replicate the results using GDP per capita as the predictor
  • Now try a different predictor
  • Interpret the results
    • What is the average effect of the predictor on conflict onset?
    • How do you interpret that effect in terms of the odds of conflict onset?
10:00

Calculating Predicted Probabilities


Probability of conflict onset for a country with a log per capita GDP of 9 (about $8,000):

\[\log\left(\frac{p}{1-p}\right) = -1.16-0.33\times 9\] \[\log\left(\frac{p}{1-p}\right) = -4.13\]

\[\frac{p}{1-p} = \exp(-4.13)\]

\[\frac{p}{1-p} = 0.016\]

\[p = 0.016 \times (1 - p)\] \[p = 0.016 - 0.016p\]

\[1.016p = 0.016\] \[p = 0.016 / 1.016\] \[p = 0.0158\]

Using marginaleffects

# load the marginaleffects library
library(marginaleffects)

# select some countries for a given year
selected_countries <- conflict_df |>
  filter(
    statename %in% c("United States of America", "Venezuela", "Rwanda"),
    year == 1999)

# calculate margins for the subset
marg_effects <- predictions(conflict_model, newdata = selected_countries)

# view the results
library(broom)

tidy(marg_effects) |>
  select(statename, estimate, p.value, conf.low, conf.high)

Using marginaleffects


# A tibble: 3 × 5
  statename                estimate   p.value conf.low conf.high
  <chr>                       <dbl>     <dbl>    <dbl>     <dbl>
1 United States of America  0.00853 4.20e-161  0.00606    0.0120
2 Venezuela                 0.0141  0          0.0113     0.0175
3 Rwanda                    0.0311  1.36e-250  0.0256     0.0377

Your Turn!


  • Select your favorite three countries and a recent year
  • Calculate the predicted proability of conflict onset for that year using the marginal effects package
  • If you have time, try to do the calcualation by hand as well
10:00

More on Odds Ratios

What is an Odds Ratio?

  • Definition: An odds ratio (OR) is a measure of association between a predictor variable and the outcome, showing how the odds of the outcome change with a one-unit increase in the predictor.
  • Interpretation:
    • OR > 1: The odds of the outcome increase as the predictor increases.
    • OR < 1: The odds of the outcome decrease as the predictor increases.

Examples


  • OR = 1.5: For each one-unit increase in the predictor, the odds of the outcome increase by 50%.
  • OR = 0.7: For each one-unit increase in the predictor, the odds of the outcome decrease by 30%.

Our Conflict Model

Variable Logit Coefficient Odds Ratio
(Intercept) -5.3342 0.0048
v2x_polyarchy -0.6304 0.5325
ethfrac 0.7615 2.1418
relfrac -0.4569 0.6332
wbpopest 0.2851 1.3298
wbgdppc2011est -0.3826 0.6821

Slide 3: Interpretation of Odds Ratios

  • (Intercept): An OR of 0.0048 indicates the baseline odds of (y) when all predictors are zero.
  • v2x_polyarchy: An OR of 0.5325 implies that for each one-unit increase in v2x_polyarchy, the odds of (y) decrease by approximately 46.8%.
  • ethfrac: An OR of 2.1418 indicates that for each one-unit increase in ethfrac, the odds of (y) increase by approximately 114.2%.
  • relfrac: An OR of 0.6332 suggests that for each one-unit increase in relfrac, the odds of (y) decrease by approximately 36.7%.
  • wbpopest: An OR of 1.3298 implies that for each one-unit increase in wbpopest, the odds of (y) increase by about 32.98%.
  • wbgdppc2011est: An OR of 0.6821 indicates that for each one-unit increase in wbgdppc2011est, the odds of (y) decrease by about 31.8%.